


2018 is shaping up to be another year of strong gold demand from central banks. The chart shows central banks on track to purchase over 400 tonnes this year.
Central Bank Sales & Purchases (1980-2018)
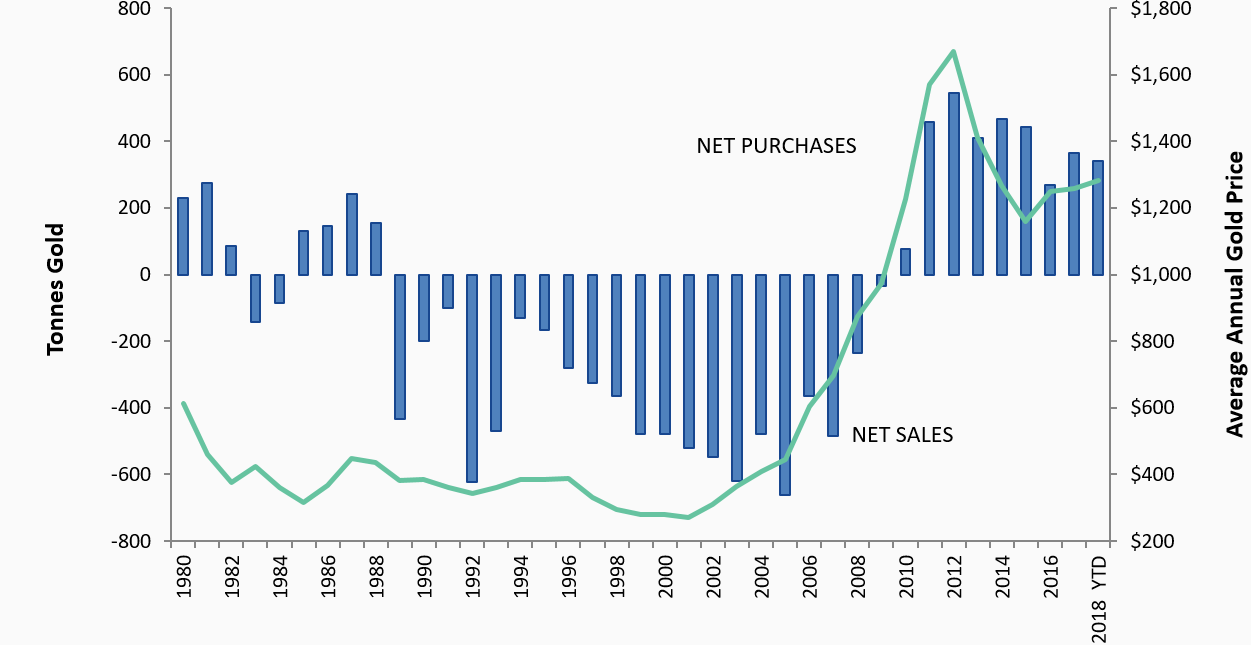
Source: Reuters GFMS, World Gold Council, Bloomberg, VanEck Research.
Banks don’t usually act as price catalysts because purchases are discreet and disclosed after the fact in IMF data with a two-month lag. However, we believe central bank demand is one of the underlying reasons the gold price has been able to establish a formidable base over the last five years.
From the chart we can see:
- Central banks don’t seem to be motivated by profit. The chart clearly shows them selling when prices are low and buying when prices are high.
- The selling from 1992 to 2007 came mainly from Western European banks. The Maastricht Treaty of 1992 established the EU. As a contiguous union, sovereign countries found they had more gold than necessary and decided to sell down their hoard.
- Net sales turned to net purchases after the financial crisis.
About the Author:
Joe Foster has been Portfolio Manager for the VanEck International Investors Gold Fund since 1998 and the VanEck – Global Gold UCITS Fund since 2012. Mr. Foster, an acknowledged authority on gold, has over 10 years of dedicated experience in geology and mining including as a gold geologist in Nevada. He has appeared in The Wall Street Journal, Barron's, and on Reuters, CNBC and Bloomberg TV. Mr. Foster has also published articles in a number of mining journals, including Mining Engineering and Geological Society of Nevada.
The article above is an opinion of the author and does not necessarily reflect the opinion of MV Index Solutions or its affiliates.