Bull markets can be classified as either secular (long term) or cyclical (bull phases within an overall bear market). Before its $1,400 per ounce breakout in June, gold appeared to be tracking, on a technical basis, similar to its 36-month cyclical bull market from 1993 to 1996. However, its current $1,500 price level hints at a potentially longer, sustained rally—perhaps more similar to the secular gold bull market of 2001 to 2008.
Gold stocks, on average, have historically outperformed gold during gold bull market cycles in the past—including through both cyclical and secular periods. This typically occurs because of their optionality to gold through earnings and resource leverage.
Gold Stocks Have Outperformed Gold in Past Bull Market Cycles1
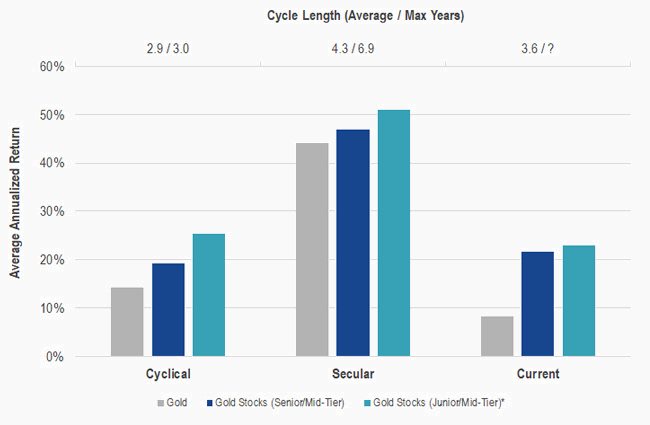
*Data first available beginning in February 1992.
Source: VanEck, Bloomberg, FactSet, Barron’s. Data as of August 2019. Past performance is not indicative of future results.
However, the greatest difference between the last bull market cycle (2008 to 2011) and the current cycle is the lengths to which these companies have gone to reduce costs and capital expenditures and to avoid mistakes of the past (such as “hedging” their production—i.e., buying futures contracts to ensure delivery of their gold at a fixed price at a later date in time—in a rising gold price environment). For senior or mid-tier miners, these efforts could translate to nearly 60% increases in free cash flow, on average, for a gold price move from $1,400 to $1,600. We believe that this makes a compelling case for gold stocks at the moment and, in particular, given their attractive valuation on both an absolute and relative basis.
Further details:1"Cyclical" bull markets include: February 1985 to November 1987; and February 1993 to February 1996. “Secular” bull markets include: October 1971 to December 1974; August 1997 to September 1980; March 2001 to February 2008; and October 2008 to August 2011. “Current” bull market includes December 2015 through most-recent month-end (August 2019). “Gold” represented by Gold Spot ($/oz). “Gold Stocks (Senior/Mid-Tier)” represented by Barron’s Gold Mining Index (BGMI) from October 1971 to inception date of the Philadelphia Gold and Silver Index (XAUTR) in January 1984 and XAU to the inception of the NYSE Arca Gold Miners Index (GDMNTR) in October 1993. “Gold Stocks (Junior/Mid-Tier)” represented by the world small-cap gold subgroup index of the Dow Jones Global Index (DJGI) from February 1992 to inception of the MVIS Global Junior Gold Mining Index (MVGDXJTR) in January 2004. “Senior” miners are defined by production levels of approximately 1.5-6.0 million ounces of gold per year (“Mid-Tier” miners approximately 0.3-1.5 million ounces per year; “Junior” miners approximately <0.3 million ounces per year). Indices are not securities in which an investment can be made. Index descriptions provided in disclosures below.
Get the latest news & insights from MarketVector
Get the newsletterRelated: