The BlueStar® Genomic Health Care Index (BDNA) tracks the performance of the largest and most liquid companies in the global genomic healthcare industry. This is a modified market cap-weighted index, and only includes companies that generate at least 50% of their revenue from health care therapies based on targeting or the modification of the genetic makeup of cells or uses mRNA, technology platforms that enable the development of genetics-based health care thearpies, or laboratory equipment or services used to test, code, or develop genetics-based health care companies.
Full MCap of at least 300 mln USD. Three month average-daily-trading volume of at least 500,000 USD at a review and also at the previous two reviews. At least 250,000 shares traded per month over the last six months at a review and also at the previous two reviews.
Universe
Companies developing or producing gene-based healthcare technologies and therapies.
A license agreement is required to use MarketVector indexes, index data or trademarks for various commercial purpose. These include research and analysis, as well as the creation, introduction, promotion, or marketing of financial products such as exchange-traded products, mutual funds, certificates, derivatives, swaps, bonds, or OTC products connected to or derived from MarketVectorTM Indexes.
We can help you learn more about acquiring a suitable license for your needs.
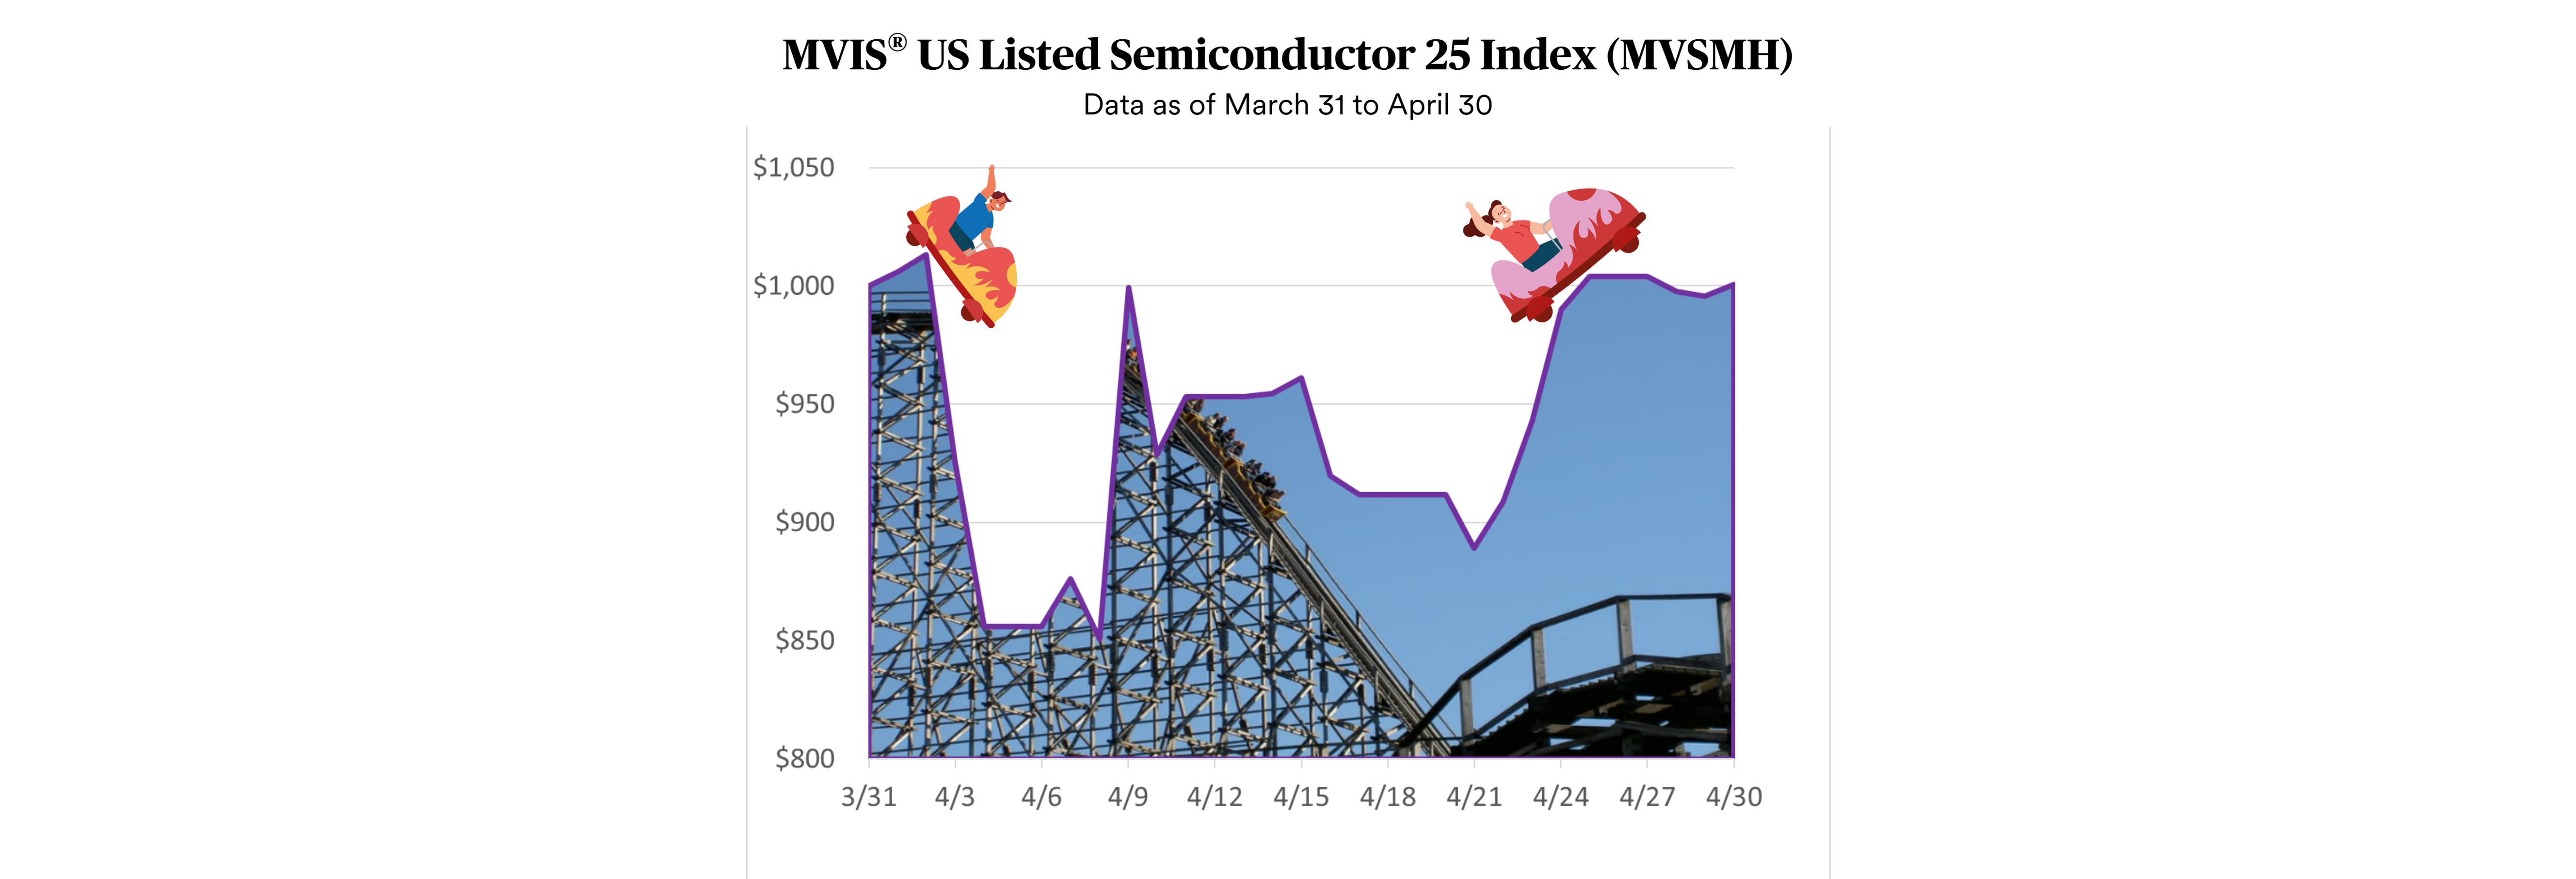
The MVIS® US Listed Semiconductor 25 Index (MVSMH) tracks the performance of the 25 largest and most liquid US exchange-listed companies in the semiconductor industry. This is a modified market cap-weighted index, and only includes companies that generate at least 50% of their revenue from semiconductors or semiconductor equipment.
MVIS® US Listed Semiconductor 10% Capped ESG Index
The MVIS® US Listed Semiconductor 10% Capped ESG Index (MVSMC) tracks the performance of the 25 largest and most liquid US exchange-listed companies in the semiconductor industry, employing a 10% capping scheme. MVSMC only includes companies that generate at least 50% of their revenue from semiconductors or semiconductor equipment.
The MVIS® US Business Development Companies Index (MVBDC) tracks the performance of the largest and most liquid Business Development Companies that are listed and incorporated in the United States. This is a modified market cap-weighted index, and only includes companies that qualify as a Business Development Company, which means it must be organized under the laws of, and have its principal place of business in the U.S., be registered with the Securities Exchange Commision, and have elected to be regulated as a BDC under the Investment Company Act of 1940.